Program "Holdback"
Calculating the Relative Efficiency of DoD Investment Programs
There is a wide variation in how the Department of Defense allocates funding for overhead costs among investment programs across the services and capability areas.
DoD needs to gain better visibility into what drives differences in overhead and support costs across its portfolio. And contractors need to understand their customers’ spending practices in these areas in order to compete effectively.
Introduction
The Department of Defense continues to struggle to gain greater efficiency in its equipment acquisition efforts. The various Better Buying Power initiatives have focused on a range of goals, with the aim of reducing the overall cost of military solutions. These include the elimination of unproductive processes and bureaucracy.
Avascent recently completed an effort aimed at measuring the cost of that bureaucracy on DoD weapons acquisition programs. To do this, Avascent undertook a detailed examination of Procurement and RDT&E programs from FY2010 through FY2015.
What Avascent found serves to update conventional wisdom regarding the degree of overhead costs burdening DoD programs. Avascent’s review also points to the need to consider multiple categories of “non-core” costs within DoD acquisition programs.
Beyond “pure” overhead costs, which contractors cannot access and which yield no warfighting value, there is a grey area formed by activities like initial training, logistics, and spares. These categories clearly provide value to the warfighter. But they may factor very differently into contractors’ perceptions of addressable budget as they consider their competitive strategies.
In an era of intense budget pressure, industry and government alike are watching every dollar and the penalty for operating on old assumptions is increasing.
Avascent now has an updated and detailed view of defense program overhead that can help give context and aid in the identification of overlooked opportunities as well as offer up novel ways that the industry can work with government to ensure that as much taxpayer value as possible reaches the people who are counting on it the most: warfighters.
Avascent’s findings demonstrate that this assumption is not far off: The average for Defense Department program expenses is about 9 percent, although there is far more variation than the conventional wisdom suggests.
Fine Tuning Assumptions
A typical assumption is that about 10 percent of the budget for a given DoD investment program is held back for the program office to cover management expenses.
That leaves 90 percent for the contractor or contractors involved in the program. Avascent’s findings demonstrate that this assumption is not far off: The average for Defense Department program expenses is about 9 percent, although there is far more variation than the conventional wisdom suggests.
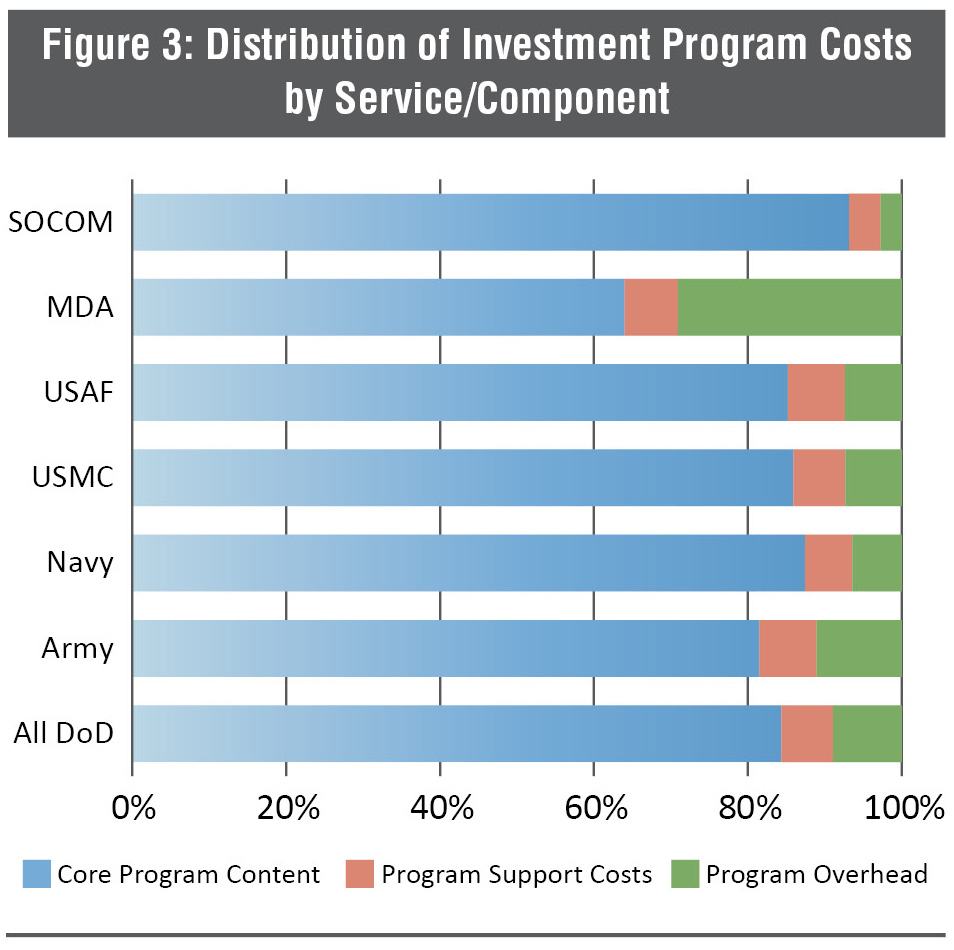
Multiple factors influence this variation. A key factor is which armed service is managing the program. Overhead levels range from a low of 2.7 percent in the Navy to a high of 11.1 percent in the Army. In addition, for reasons unique to its particular role, the Missile Defense Agency features overhead levels that are comparatively off the charts, at around 29 percent. The variation among these customers is driven by a number of factors, a key one being the types of solutions they acquire.
In terms of DoD equipment acquisition, ships feature a deceptively low rate of “holdback,” at just 5.4 percent. (More on this below.) While missile systems – including complex ballistic missile defense systems – feature a rate of over 12 percent. As with the variation that characterizes different DoD customers, holdback rates among different investment categories is driven by many factors, including program lifecycle.
To be sure, excluding programs and customers whose unique circumstances drive sharp differences in overhead rates, the range of variation among the Services is not extreme. But even modest differences can be significant in terms of value to the contractor. More so in dealing with billion-dollar contracts where small percentages can equate to tens of millions of dollars.
Avascent Sources and Methods
In order to assess how efficiently DoD spends its acquisition resources, Avascent drew on its proprietary database of global defense procurement. This database tracks supply and demand for military equipment among 51 countries, including the United States. This Global Platforms & Systems database draws directly on DoD’s Procurement and RDT&E budgets as source data for U.S. programs. The database breaks down DoD investment programs well below the Program Element (PE) level, and thus allows the user to itemize all discrete cost categories that comprise each program’s budget.
Avascent assigns each of these cost categories to one of 10 “Cost Types,” which represent a range of functional areas within an overall program. These Cost Types can be arranged in three broad categories, including core program content (that is, the “thing” being acquired), program overhead, and program support costs. (See figure 1.)

By organizing program budgets among these categories, Avascent can draw conclusions about the relative utilization of available budget across the Services and investment categories.
This analysis examined budgets for the period fiscal year 2010 through 2015. All years except FY2015 included Overseas Contingency Operations (OCO) appropriations. The FY2015 data represented the Department’s budget request.
Avascent reviewed programs that comprise roughly 67 percent of the total value of the Procurement and RDT&E budgets. A few categories of equipment were omitted from this analysis. For example, classified programs, which account for around 9 percent of total DoD investment resources, do not show a transparent record of spending among different Cost Types, and so cannot be analyzed in an unclassified forum. In addition, Avascent excluded much of the spending in the RDT&E Management Support account within the overall RDT&E budget. This is because much of this funding goes to sustain DoD’s laboratory and test & evaluation infrastructure, as opposed to direct investment in warfighting capabilities.
Diving into the Data
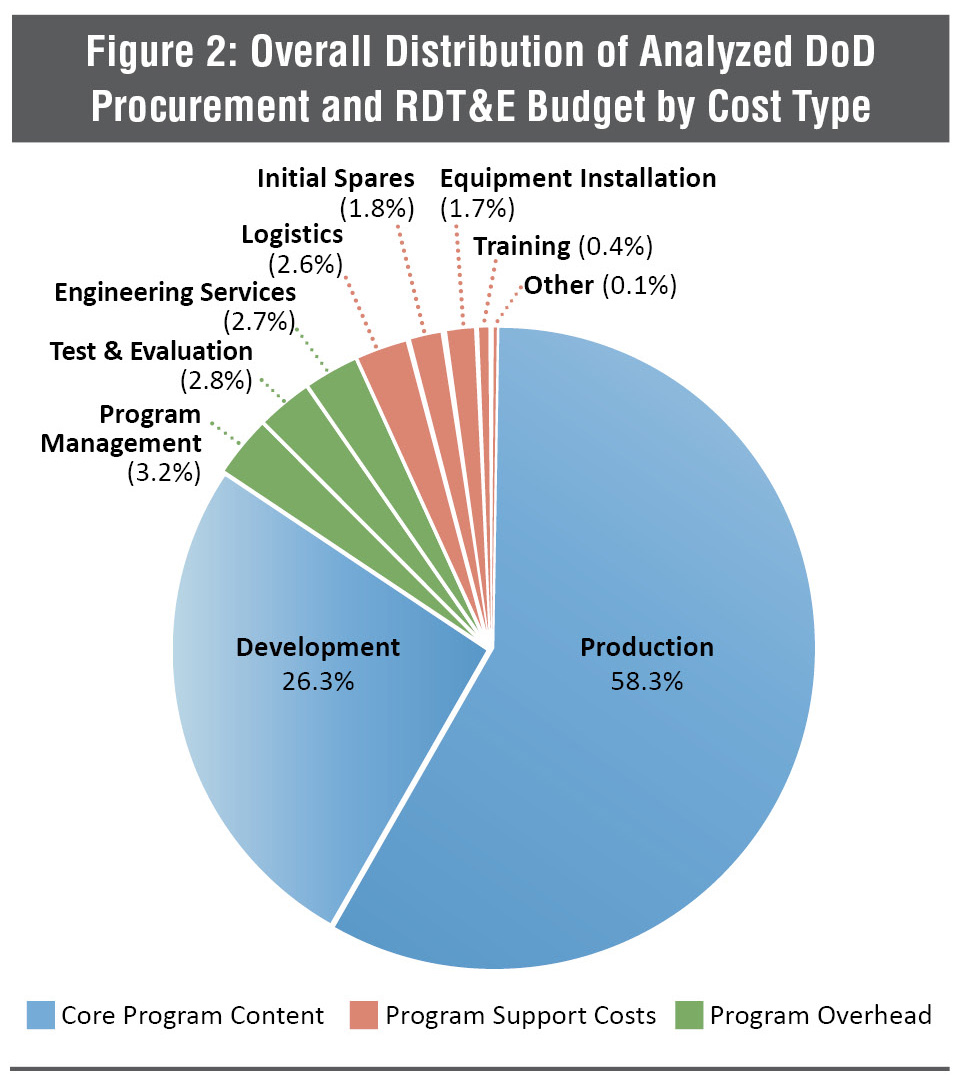
Overall, the DoD average for FY2010 to FY2015 overhead costs is about 9 percent. These overhead costs comprise program management, test & evaluation, and engineering support services. (See figure 2, below.) In addition, the DoD investment program overall features program support costs of about 6.7 percent. The remainder, approximately 84 percent, is expended on the development and production of the core content itself.
Looking at the data by service shows some specific trends, some of which are explainable by the urgent wartime programs of the past decade and others that may reflect variations in largely standardized approaches to major acquisitions.
Army
Avascent found the Army’s level of overhead costs to be the highest among the Armed Services, at 11.1 percent. Further, the Army features program support costs (e.g., logistics, spares, training) in the range of 7.4 percent. Both of these figures are among the highest observed among all DoD components.
But the Army’s overhead and program support costs are skewed by the MRAP program. This program, which accounted for about $10.3 billion in the period under review here, featured very high logistics and program management support costs. These costs were driven by the need to acquire large numbers of vehicles very rapidly from multiple sources, and to rapidly field them. This latter point raises the question of whether, in the interests of rapid program execution, the MRAP program was driven to fund a fielding and logistics activity with Procurement dollars that, under different circumstances, might have been borne with Operations and Maintenance (O&M) resources.
Navy
Overall, the Navy’s program budget parameters are generally comparable to the other Services. The Navy’s investment budget features roughly 6.5 percent in overhead and 6.1 percent in program support costs.
At first blush, these results are puzzling. The Navy, after all, acquires some of the most complex systems in the DoD inventory, in the form of surface combatants, submarines and aircraft carriers. How is the Navy able to contain program overhead costs so effectively for systems of this scale and complexity?
The answer may lie in how the Navy funds its ship acquisition bureaucracy. The Navy budgets a substantial sum of O&M funds for activities related to ship acquisition oversight. Avascent estimates that in FY2014, these activities drew around $1.9 billion in O&M funds under the “Logistics Operation and Technical Support” activity group. These funds are geared heavily to ship-related activities, which might otherwise be borne by the Navy’s SCN and RDT&E accounts.
Air Force
The Air Force’s program budget parameters are also largely in line with the other Services. Avascent estimates that the Air Force spends around 7.4 percent each on program overhead and program support costs.
But the true efficiency of Air Force investment activities is particularly hard to judge because so much of the Service’s Procurement and RDT&E budget is classified. Avascent estimates that nearly half of the Air Force’s total investment budget is classified. This includes large portions of the “Other Procurement, Air Force” and Air Force RDT&E budgets that are likely used to fund intelligence activities outside the Service’s direct control. The relative efficiency of these investment activities can only be guessed at in an unclassified forum.
Marine Corps
The Marine Corps investment budget is heavily weighted to production, compared with development activity. This is the case even when one accounts for USMC-specific line items that are nominally funded under the Navy’s RDT&E budget. This focus on near-term procurement requirements comes as no surprise, given the Service’s role.
What is surprising is that the Marines’ level of program overhead is not significantly lower than that of the other Services. At 7.3 percent, it is higher than that seen in the Air Force, for example. The Marines’ level of program support costs is also broadly comparable, at about 6.8 percent. This belies widespread perceptions of the Marines taking a bare bones approach to equipping the force.
Outliers: MDA and SOCOM
While the Army, Navy, Air Force and Marine Corps have budget parameters that are largely in line with each other, there are two interesting outliers: the Missile Defense Agency (MDA) and U.S. Special Operations Command. These two agencies lie at opposite ends of the program efficiency spectrum, bracketing the four Services’ parameters on either end. And the results from Avascent’s analysis indicate that a customer’s investment focus, warfighting mission, and operational ethos can contribute decisively to the outlines of its investment-spending pattern.
MDA devotes a vastly larger share of its program budget to T&E and SETA costs, than the Services. These intensely complex systems have unique requirements for engineering support services, and highly expensive testing regimes. As a result, MDA features program overhead costs in excess of 29 percent, more than double that of the next closest agency.
The other outlier is U.S. Special Operations Command. SOCOM devotes a significantly lower than average share of total program cost to internal support activities, just 2.7 percent. In program support costs also, SOCOM spends significantly less than the average, at just 4.1 percent. This reflects the rapid nature of SOCOM acquisitions.
This speed and efficiency in systems acquisition distinguishes SOCOM from the rest of DoD. It is a central reason why SOCOM is a highly attractive customer to defense companies. Many firms aim to make a quick sale to SOCOM, and then parlay acceptance by the military’s elite as a platform to expand into the “Big Army.”
As SOCOM grows in headcount, budget and operational responsibility, it is worth considering if the command can maintain this level of acquisition efficiency. With greater formality and structure, there is a risk that SOCOM acquisition habits will drift toward the mean.
Overhead Analysis by Investment Categories
Investment efficiency is driven by more than which agency or department is buying. What the customer buys has a clear effect on the level of program overhead and support costs.
Ground Vehicles
The ground vehicle investment portfolio is surprisingly inefficient in its use of investment resources. To be sure, the multibillion-dollar MRAP program skews the figures by a notable degree. The need to acquire large numbers of multiple designs quickly, and field them to multiple war zones drove substantial “non-core” costs, including both overhead and program support.
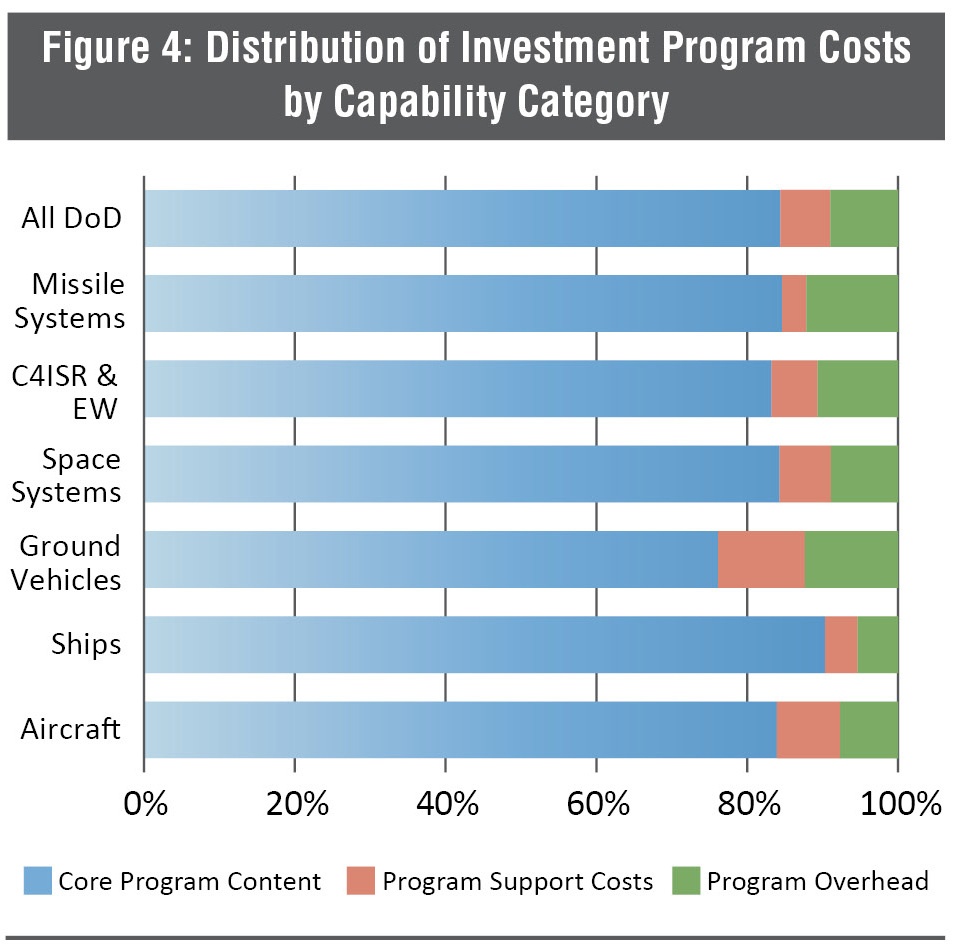
Including the roughly $10.3 billion in MRAP investment during the period under review here, the ground vehicles portfolio featured an overhead rate of 12.4 percent. The rate of program support costs was 11.5 percent. The MRAP program put particularly heavy demand on the latter category. Of the $10.3 billion spent on MRAP programs from FY2010 through 2015, fully 27 percent was related to logistics and fielding activities, and another 5 percent to installation of equipment on the vehicles.
However, even excluding MRAP from the figures, the ground vehicle portfolio features a surprisingly high degree of overhead costs, at 13.3 percent. There are many reasons for this. There has been a great deal of churn in the ground vehicle modernization effort, with programs like Ground Combat Vehicle and Marine Personnel Carrier rising to prominence and then falling by the wayside. Within this period, the Army’s sprawling Future Combat System (FCS) program broke apart and faded away. At the same time, a number of tactical wheeled vehicle programs, like the Families of Medium and Heavy Tactical Vehicles (FMTV and FHTV) have seen their buy rates collapse from OCO-funded peaks.
While a number of individual vehicle programs feature overhead rates very close to the broader investment average, the accumulation of this program upheaval has led to a suboptimal use of resources.
There is more Air Force budget being allocated to initial spares, prompted by the growing F-35 fleet as well as other mature development programs shifting to production.
Aircraft
Spending proportions on aircraft are close to overall averages, with two notable trends changing over time. The first is the growth in relative spending on equipment installation as upgrades increase in importance with an ageing fleet. As well, there is more Air Force budget being allocated to initial spares, prompted by the growing F-35 fleet as well as other mature development programs shifting to production.
Missile Systems
Missile systems have an overall high level of spending on program management, notably SETA and T&E spending. This is influenced, in part, by the heavy presence of MDA programs in this category. As noted above, ballistic missile defense involves some of the most complex technologies and “system of systems” interactions that DoD aims to master.
But even excluding MDA from the portfolio of missiles and other precision weapons, program overhead rates at 10.7 percent are still relatively high. The drivers of these costs are not program management, but SETA and T&E requirements. The rationale behind these costs varies widely across a number of programs. In some cases, early-stage programs draw high rates of engineering support sums, relative to core product development. In other cases, active production programs appear to need a large expenditure on production engineering support.
Ships
As discussed previously, there is a notably low share of program budgets dedicated to management and other overhead costs. Collectively, ship programs feature overhead rates of just 5.4 percent, well below the average of nearly 9 percent. And program support costs of about 4.3 percent are well below the average of 6.6 percent.
But, to reiterate a point made above, the Navy is able to employ O&M funding for ship acquisition support in a way that unburdens individual programs from carrying some costs.
C4ISR and Electronic Warfare
In the C4ISR and EW segment, Avascent sought to measure spending not just on “stand alone” programs, but also on C4ISR and EW content acquired within other programs, particularly aircraft and ships. Avascent’s Global Platforms & Systems database allows either a roll-up or a disaggregation of value within various platforms.
C4ISR, in particular, is an area where customers can draw on solutions from players beyond traditional prime contractors.
At first blush, rates of overhead and program support spending among C4ISR and EW programs is somewhat high – at 10.7 and 6.1 percent, respectively – but not far out of line with broader averages. The specific areas of SETA and equipment installation, however, are notably higher than in the broader investment program.
One unique aspect of this area is the customer’s ability to generate capability using acquisition practices that can be different from the standard “program of record” model. C4ISR, in particular, is an area where customers can draw on solutions from players beyond traditional prime contractors. Many customers contract for engineering support services via indefinite quantity/indefinite delivery (ID/IQ) contracts, and may draw on these to backfill for capability improvements outside the grasp of traditional primes. This likely explains the relatively high SETA expenditure in the C4ISR and EW realm.
This also suggests that C4ISR and EW capabilities are being “subsidized” from the O&M accounts, not unlike the dynamic seen above in ships. Tracing O&M funds to specific C4ISR systems is notoriously difficult, given the structure of that budget. But it is clear that acquisition organizations that focus on these capabilities draw on these funds for product sustainment work, at a minimum. But the same acquisition channels that DoD uses for sustainment can be used for incremental improvement and innovation in many of these software-centric capabilities.
Space Systems
Overall, space systems feature rates of overhead (8.9 percent) and program support costs (6.8%) that are almost precisely in line with broader averages. There are several other considerations to bear in mind, however, when thinking about these figures.
First and foremost is the reality that total investment in space-related systems cannot be truly known by looking only at unclassified data. As tallied here, investment in space systems (which encompasses satellites, launch vehicles, and space range infrastructure) totals just $32.9 billion over the six years under review. By contrast, investment in airborne systems totals nearly five times that level of spending. Clearly, a substantial portion of space-related investment takes place classified realm, and thus cannot be analyzed here.
Second, it is important not to equate “program efficiency” as we have used the term here with “program success,” as measured in the ability to remain on budget and schedule. It is notable, for example, that satellite programs featured 11 Nunn-McCurdy breaches between 1997 and 2009, according to data compiled by the Government Accountability Office (GAO). Only aircraft programs featured more such troubles. Rather, the data examined here indicate only that space programs, whatever their outcome, do not tend to draw on non-core costs in a manner that are out of line with broader DoD practices.
Areas of Opportunity
With this more precise understanding of how the armed services budget for supporting and overhead costs, contractors can better calibrate their bid prices to their customers’ available budget. This is nothing new in the industry. An elemental part of any company’s price-to-win exercise involves gaining a clear picture of the truly available portion of the target program’s budget.
Firms positioned with key customer agencies as providers of technical support services have an opportunity to capitalize on requirements that may otherwise be folded into traditional solution contracts.
But it can also be important to understand the broader tendencies and tolerances of various customer groups. Individual program budgets can change from year to year, as broader pressures are exerted across constituencies, and “fact of life” changes are implemented. Knowing the range of acceptable behavior across specific customer agencies and in particular investment areas can help contractors understand how much latitude they are likely to have over the long-term of a program. Avascent’s database can be configured to address these more narrow areas of focus.
It is critical to understand how customers plan to acquire the range of activities encompassed here under “program support costs”: Initial training, spares, logistics and fielding support. These can be integrated into a production or development contract. In such a case, bidders must factor delivery of these products and services into their offered price. In an environment of heightened cost consciousness, this requires blending business models and cost structures to remain competitive.
For contractors outside the traditional bounds of “solution providers,” this analysis suggests areas of opportunity. Firms positioned with key customer agencies as providers of technical support services have an opportunity to capitalize on requirements that may otherwise be folded into traditional solution contracts.
Conclusion
Today, every dollar counts, for government and contractor alike. Playing a supporting role in acquisitions and services is a viable opportunity, and as the Avascent data show, it is a potentially attractive opportunity where industry and government can find aligned interests. Understanding the opportunities at hand requires updating assumptions, however. Once that is done, there is a chance to plan how to go after overlooked opportunities.